

The Ministry of Health Malaysia has made COVID-19 pandemic related data available on Github late last week. It was also announced by the Director-General of Health, Dr Noor Hisham Abdullah.
In the repository, you will find anonymous granular data on hospital admissions, critical care (ICU), & even MOH’s cluster-based analysis of transmission. In addition, we are also making public data on mobility & contact tracing, powered by MySejahtera. The mobility data even provides insight on the time density of check-ins, something that most other mobility datasets do not contain.
https://covid-19.moh.gov.my/semasa-kkm/2021/07/moh-open-sourcing-extremely-rich-data-on-the-pandemic-at-github
You can check out the Github repo at https://github.com/MoH-Malaysia/covid19-public

Personally, I am interested in the ICU dataset. When we see a large number of new positive cases reported daily, I start to wonder about the condition of ICU in Klang Valley especially. There wasn’t much information pertaining the ICU utilization in the country, not even at the state level.
Data Visualisation Tools
Disclaimer: I am not a data scientist or near the field. The below documentation is my personal journey to dabble in something new. Agmo Studio encourages employees to learn new skills and technologies to broaden their skillset and not to be constrained by their existing job scope.
Earlier this year, an acquaintance of mine showed a simple data visualisation from a certain social media platform. I was amazed. All he did was just write an SQL, a chart was generated to represent the queried data set.
Previously I had tried out Jupyter Notebook with Pandas and Matplotlib to draw charts. It wasn’t bad or anything, but my goal is to do simple data visualisation with as little code a possible.
Enter Apache Zeppelin, a web-based notebook that enables data-driven, interactive data analytics and collaborative documents with SQL, Scala and more.
This is the tool that I chose to use for this round of data visualisation.
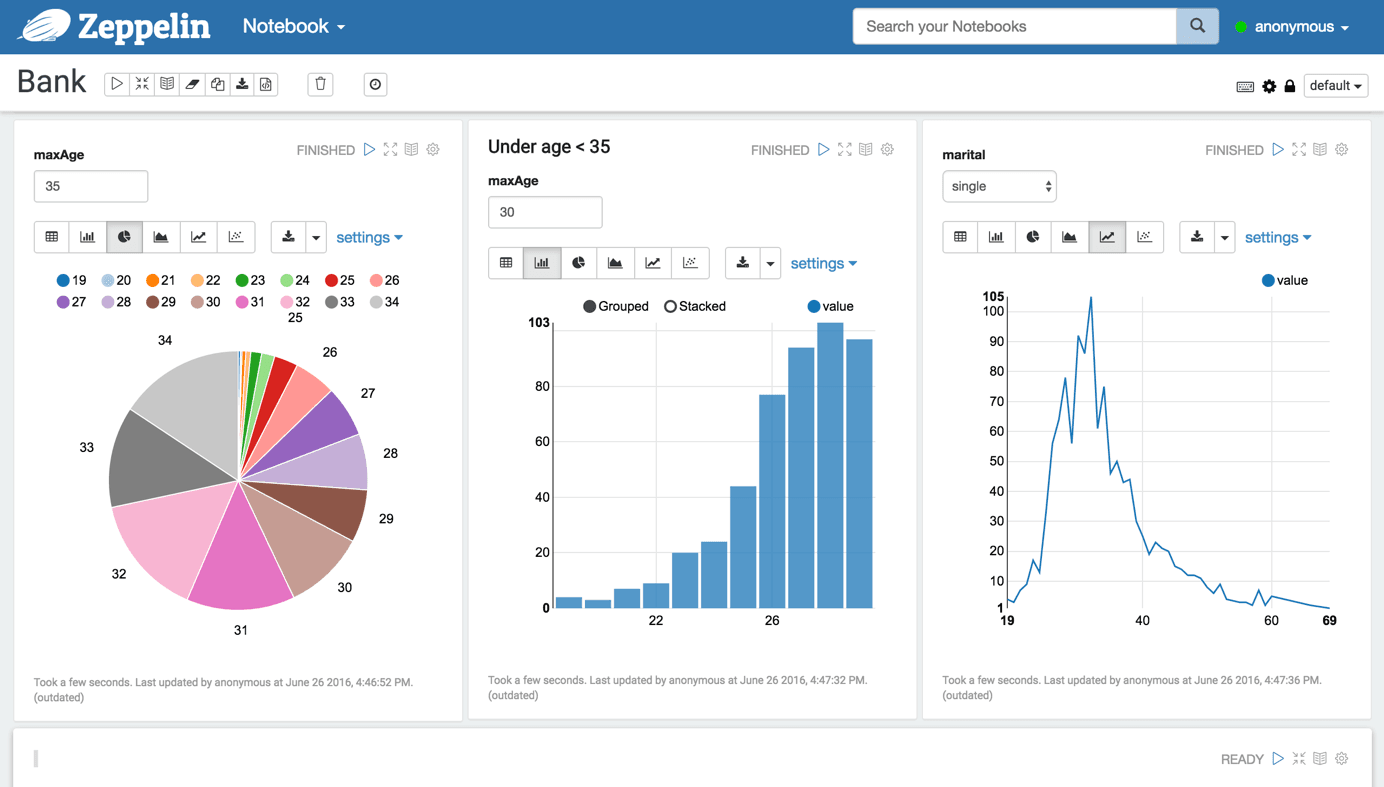
UI of Apache Zeppelin
Setting up
To skip all the hassle of installing and configuring Zeppelin and any dependencies, I have chosen to use the Zeppelin Docker image.
The command that I used
docker run -p 8080:8080 --restart unless-stopped -d \

-v $PWD/zeppelin/logs:/logs \

-v $PWD/zeppelin/notebook:/notebook \

-e ZEPPELIN_LOG_DIR='/logs' \

-e ZEPPELIN_NOTEBOOK_DIR='/notebook' \

--name zeppelin apache/zeppelin:0.9.0
This will create a zeppelin folder in your current terminal working directory and creates a log and notebook folder in it. You will then be able to access Zeppelin using a web browser at http://localhost:8080
Preparing the Data
Create a notebook in Zeppelin. We will start by downloading the latest ICU CSV data from Github and save it into the /notebook directory.
%sh

cd /notebook

wget https://raw.githubusercontent.com/MoH-Malaysia/covid19-public/main/epidemic/icu.csv
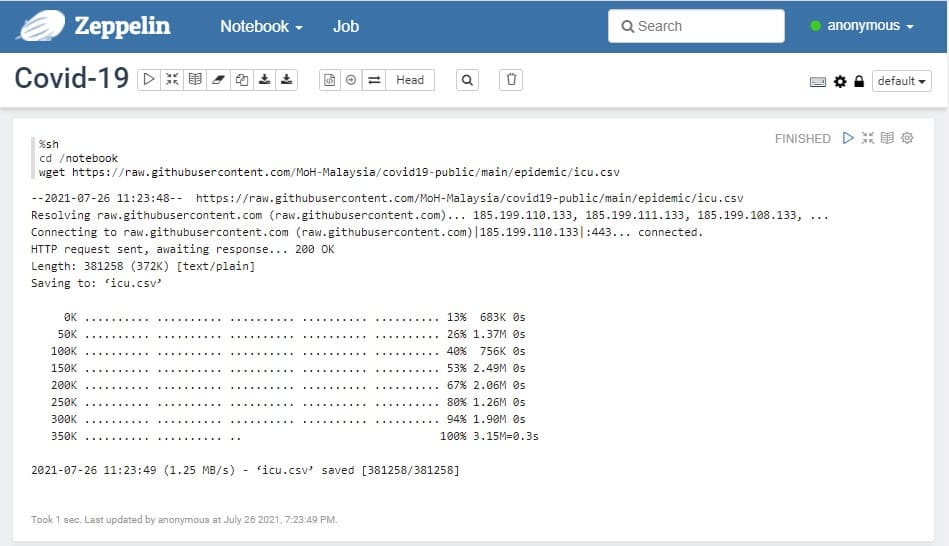
Next, we will have to create a TempView that represent the CSV data using the PySpark interpreter
%pyspark

icuFile = "/notebook/icu.csv"

icuData = spark.read.csv(icuFile, header=True, mode="DROPMALFORMED", inferSchema=True)

icuData.createOrReplaceTempView("icu")
Now we are ready to perform queries on our data.
Querying Data
We can easily query the data using Spark SQL. You can read more at https://spark.apache.org/sql/
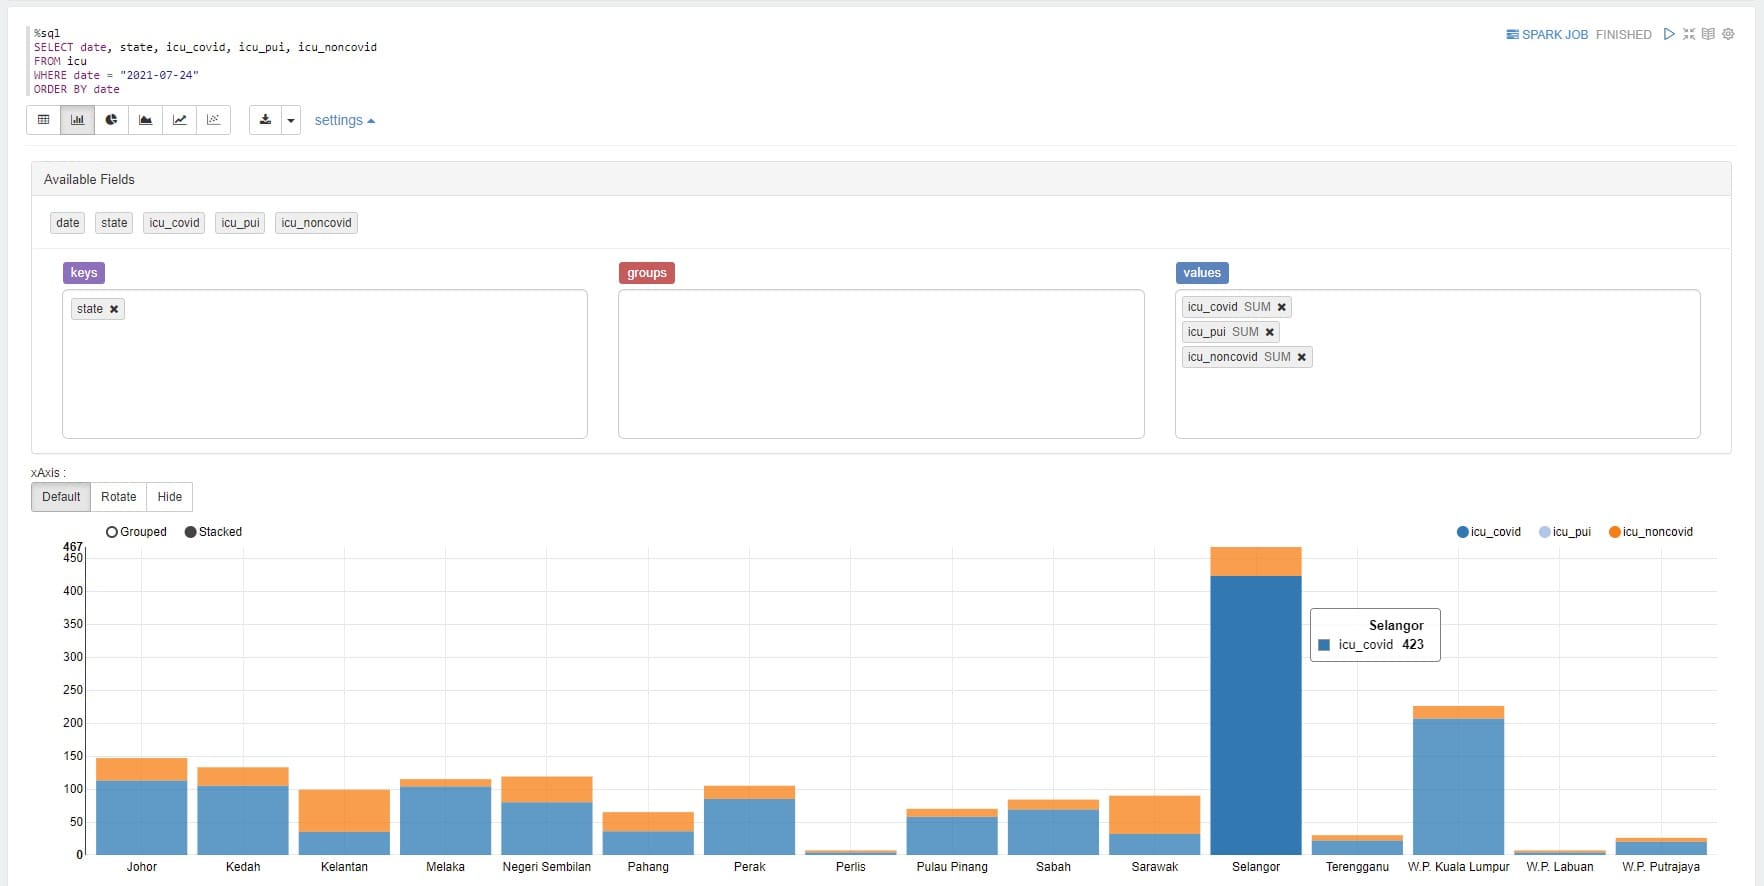
ICU Bed Utilization Types by States on 24 July 2021
Here is an example of ICU bed usage by covid positive, suspect, non-covid on 24 July 2021 by states
%sql

SELECT date, state, icu_covid, icu_pui, icu_noncovid

FROM icu

WHERE date = "2021-07-24"

ORDER BY date
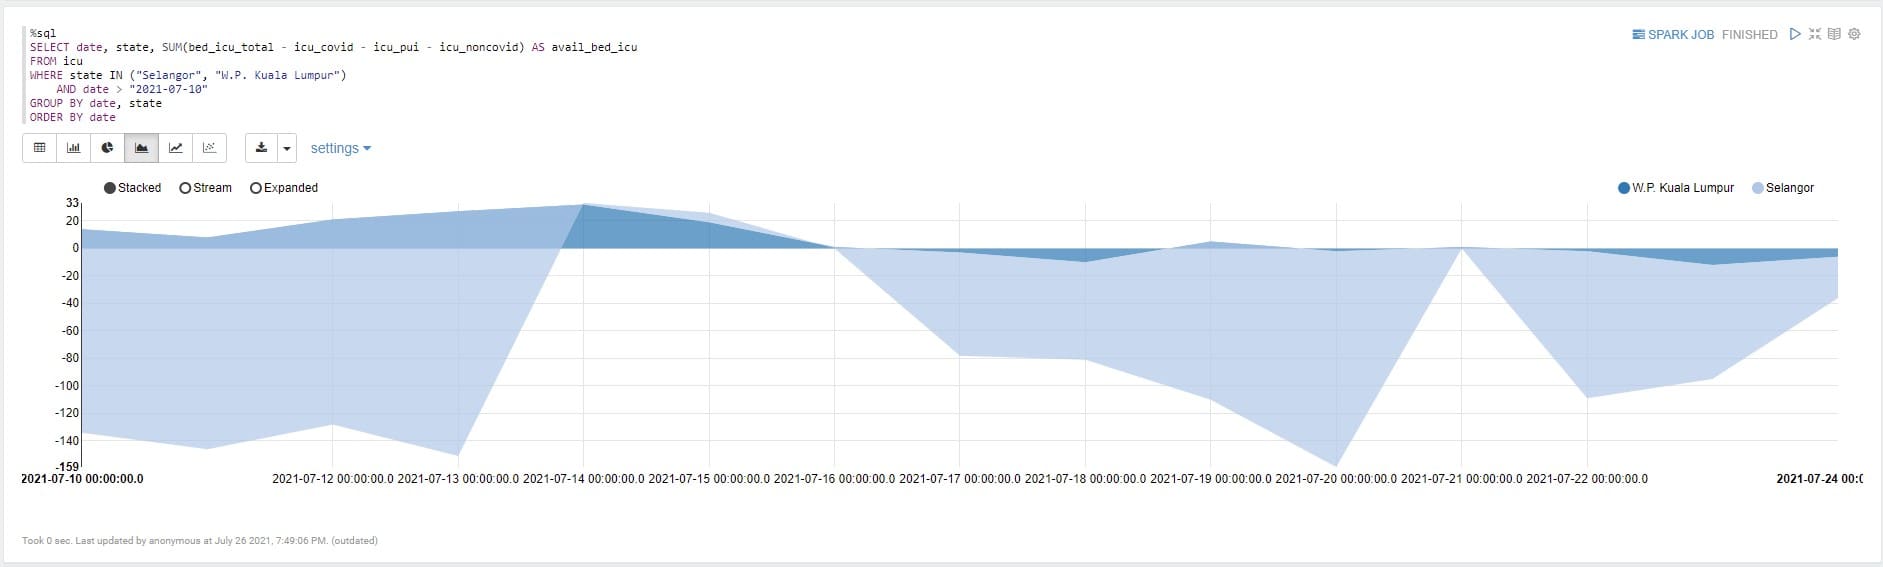
Available ICU Beds Past 14 days in Klang Valley (7 Jul 2021 – 24 Jul 2021)
I wasn’t too sure if the fields I used is correct. Based on the description of the column, this should be the math to calculate available ICU beds. It does look grim where there are a fair number of days where there are more critical patients than beds.
%sql

SELECT date, state, SUM(bed_icu_total - icu_covid - icu_pui - icu_noncovid) AS avail_bed_icu

FROM icu

WHERE state IN ("Selangor", "W.P. Kuala Lumpur")

AND date > "2021-07-10"

GROUP BY date, state

ORDER BY date
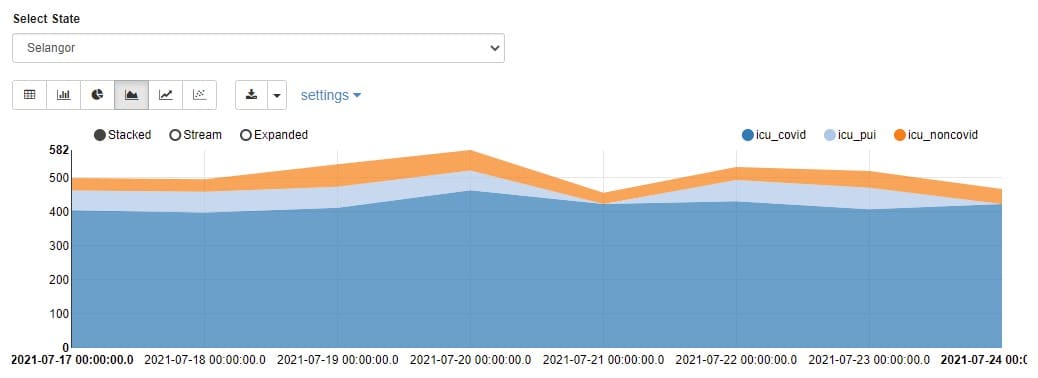
ICU Case Type Past 7 Days with Selectable State (17 Jul 2021 – 24 Jul 2021)
In this final example, I have made a dropdown (declared in the SQL) to display the past 7 days of ICU bed utilisation by covid-positive, suspected, and non-covid.
I will leave it as an exercise for readers to find out how to create the dropdown.
Final Thoughts
It took a short few hours to learn and reach my goal. Albeit it was a little simple, I am definitely happy with the results. Remember ya’ gotta make small achievable goals, or you’re setting yourself up to fail.
Signing off,
Andhie | Head of Mobile | Agmo Studio